CountBio
Mathematical tools for natural sciences
Biostatistics with R
Data types
Qualitative and Quantitative variables
In scientific observations, any quantity we measure in terms of a number or category or quality is called a variable. Thus the quantities like agem weight, blood pressure, sex, amount of drug consumed per day by a person, relief from pain all constitute a variable. In any experiment, we measure certain variables of a system under a given condition. The variables measured are either qualitative or quantitative in nature.
The quantitative variables(also known as categorical variables) have no natural sense of ordering, and cannot be represented by numbers. For example, the color of our urine can be described to be "Brown" or "Orange" or "Pink" or "Green" or "Amber coloured" without attaching a number to describe it.
On the other hand, the quantitative variables (also known as continuous variables) can be associated with numbers to describe them. The number of eggs that hatch in a small chicken form can be a number like 1523. The height of a patient admitted to a clinical trial is measured to be 168.4cm.
Data and types of data
The values of qualitative or quantitiative measurements from an experiment or observation is called data . In modern English, the word data can be used as a singular or plural. We can thus say that "the data were collected" and also "the data was transferred from the scanner to the computer".
Every single measurement in a data is called a data point . Thus, if we measure a quantity Q at 10 different concentrations of a solution, we have collected 10 data points that represent the relation between concentration of the solution and Q. If we repeat a measurement R ten times under the same condition, we have collected 10 data points of the repeated measurement.
A data in its original form as derived from an experiment is called raw data. The raw data is processed and analysed to derive any information from it. A raw data, after processing and analysis, is converted to a conveniently reduced format called the processed data .
Discrete and Continuous data
The quantitative data that can be represented by numbers falls under two categories, namely the discrete and continuous data types.
A data type is discrete if it can take only a finite number of values in a given range. For example, if the maximum number of patients a hospital can admit is 500, the number of patients registered there on a given day will be an integer between 0 and 500.
On the other hand, a continuous data can take infinite number of values in a given range. Take the data on the weight of human beings. Within the possible range of weights for human beings of all ages, we can get any real number between (say) 1 Kg to 300 Kg. Depending on the accuracy of the measurement, a data point from the weight measurement can have any one of the infinite number of possible values like 15.5 Kg, 59.55Kg, 59.5598Kg, 56.2234566Kg, etc. (Though it is ridiculous to give the weight of a person as 56.2234566 Kg, it is technically possible and mathematically valid!). Thus a data point from a continuous data set can take infinite number of possible values in the allowed range and in general represented by a real number.
It is important to know whether our data is discrete or continuous because they follow different statistical distributions, and the statistical methods used for their analysis are sometimes very different.As an example, consider the measurement of differential gene expression between control and disease samples under a disease condition. When these studies are carried out using microarrays, the measured expression levels are continuous numbers. The same studies are also done using RNA sequencing techniques in which the expressions are proportional to the number of reads mapped to the genomic regions. This makes the expression level data a discrete quantity (this is also called as digital gene expression). Different statistical methods are used for their expression analysis.
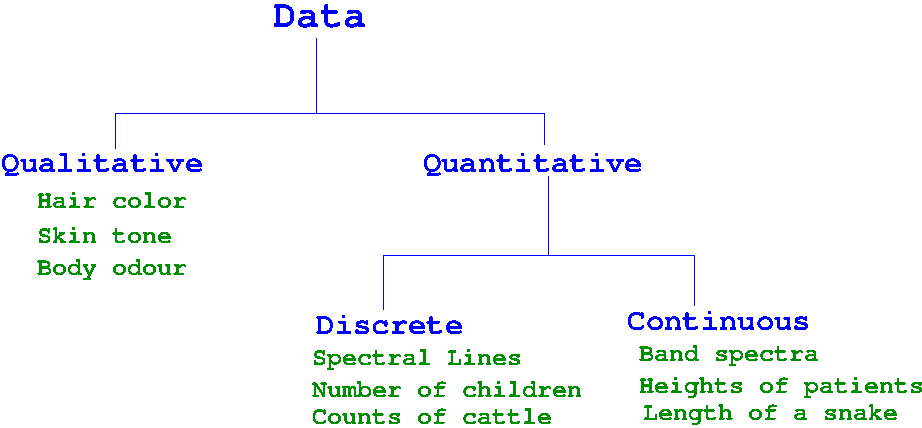
The following figure summarises the data categorization discussed so far: