Chi-square goddness of fit test
While discussing the continuous distributions, we learnt about the Chi-sqaure (\(\small{\chi^2}\) ) distribution which is closely related to Normal distribution.
If X is a random variable sampled from a normal distribution \(\small{N(\mu, \sigma)}\) of mean \(\small{\mu}\) and standard deviation \(\small{\sigma}\), then
the distribution of \(\small{Z=\dfrac{X-\mu}{\sigma}}\) is unit normal distribution \(\small{N(0,1)}\), while
the distribution of \(\small{Z^2}\) is a (\(\small{\chi^2}\) ) distribution.
If we draw one random point \(\small{x_i}\) from norml distribution \(\small{N(\mu, \sigma)}\) of mean \(\small{\mu}\), then the square of the Z transformaton \(\small{(z_i=\dfrac{x_i-\mu}{\sigma})^2}\) will be (\(\small{\chi^2}(1)\) ), a chi-square distribution with 1 degree of freedom.
Extnding this, if we draw n data points \(\small{x_1,x_2,x_3,...,x_n}\) from the normal distribution, then the square of sum of their individual Z transformed values follow a \(\small{\chi^2}\) distribution with n degrees of freedom:
\(\small{(\dfrac{x_1-\mu}{\sigma})^2 + (\dfrac{x_2-\mu}{\sigma})^2 +......+(\dfrac{x_n-\mu}{\sigma})^2 = \chi^2(n) }\)
Using the bove properties of (\(\small{\chi^2}\) ) variable, a
goodness of fit test has been proposed which compares the frequencies of events
expected based on some theory and observed in the experiment.
The
observed frequencies are the number of samples under various categories we observed in the actual experiment, while
expected frequencies are based on the predictions under null hypothesis.
Suppose there are n categoroesin the data. Let \(\small{O_i}\) be the observed frequency and \(\small{E_i}\) be the expected (theoretical) frequency of category i under null hypothesis. Then the Chi-square statistics
\(~~~~~~~~~~~~~~~~~~~~\small{\chi^2~=~\dfrac{(O_i - E_i)^2}{E_i^2}}\) is a \(\small{\chi^2(n-2) ~~}\)under null hypothesis of no change in frequencies.
This procedure tests whether the pairs of expected and observed frequencies for each category closely agree with each other. If the expected and observed frequencies are exactly same for all categories, values of \(\small{\chi^2}\) statistic will be zero, and null will be accepted. As the observed frequencies start deviating from theoretical frequencies, value of \(\small{\chi^2}\) variable increses and gets closer to the rejection region of null hypothesis.
Chi-square goodness of fit test procedure
1. Decide the n categories in the data
2. Compute the expected frequencies \(\small{E_i}\) under null hypothesis.
3. Get the observed frequencies \(\small{O_i}\) for the n categories of data.
4.Compute the test statistic \(~~\small{\chi^2~=~\dfrac{(O_i - E_i)^2}{E_i^2}}\)
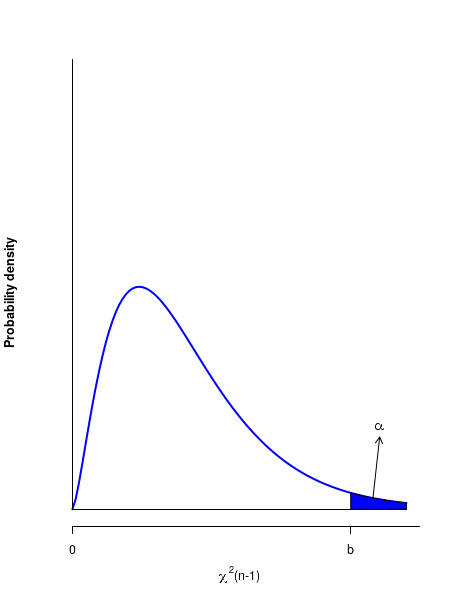
5. Compute the critical value \(\small{b = \chi^2(n-1, \alpha) }\) for the given confidence level \(\small{\alpha}\).
6. The rejection region is to the right of \(\small{b=\chi^2(n-1, \alpha) }\) on the distribution.
7. Reject null if \(\small{\chi^2 \gt b}\).
See the figure below for the critical region
R-scripts
 Example-1 :  In across breeding experiment with a species of flower, the genorypes of four alleles named X1,X2,X3 and X4 are expected to be present in a ratio of 1:2:2:1. For 240 observations, the frequencies of corresponding phenotypes observed were as follows : X1:X2:X3:X4 = 36:84:75:45. Perform a chi-square test to estimate whether the observed frequencies are consistent with the theoretical rations expected.

Based on the expected ratio 1:2:2:1, the expected frequencies X1:X2:X3:X4 = 40:80:80:40. We can perform the chi-square test in R as follows:
#  Chi-square goodness of fit test:

Observed = c(32, 82, 77, 49)

Expected = c(40,80,80,40)

alpha = 0.05

n = length(Observed)-1

chisquare = sum( (Observed - Expected)^2/Expected )

b = qchisq(1-alpha, n-1)

if(chisquare > b){
 print("Null rejected :")

 print(paste("critical value = ", b,"  chi-square statistic = ", chisquare))

} else {

 print("Null accepted :")

 print(paste("critical value = ", b,"  chi-square statistic = ", chisquare))
}

pvalue = pchisq(chisquare, n-1)

print(paste("p-value for test = ", round(pvalue,4)))
Running the above code prints the following output:
[1] "Null rejected :"
[1] "critical value =  5.99146454710798   chi-square statistic =  3.7875"
[1] "p-value for test =  0.8495"