CountBio
Mathematical tools for natural sciences
Biostatistics with R
Covariance and Correlation
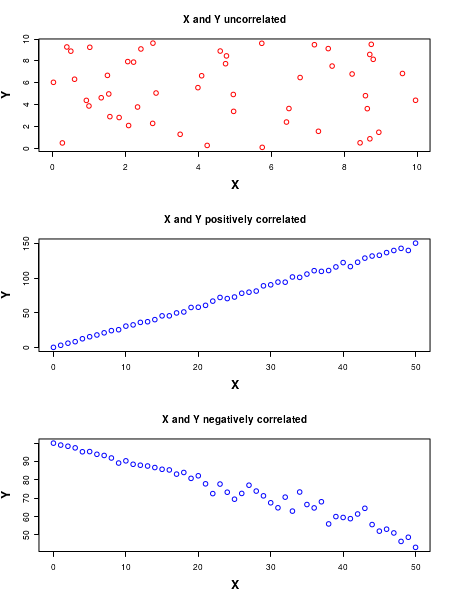
Consider two random variables X and Y that take numerical values. What kind of relationship can exist between X and Y?
There are three possibilities: 1. There is no relatonship between X and Y. ie., they are independent of each other. 2. When X increases, Y also increases. The two vriables are said to be positively correlated 3. When X increases, Y decreases.The two variables are said to be negatively correlated See the figure below:
Covariance
Covariance is a measure that detects whether two variables vary together or independent of each other.
If X and Y are two data sets with size n and sample means \(\small{\overline{x}}\) and \(\small{\overline{y}}\) respectively, then the
covariance of X and Y is defined as,
Correlation coefficient
The covariance Cov(X,Y) described above is not normalized. The positive and negative values taken by Cov(X,Y) can be very large or small depending on the unit chosen for X and Y.
In order to tackle this problem, a term called correlaton coefficient is defined to normalize X and Y to their standard deviations, thus making the quantity a dimensionless number between -1 to +1 through zero.
There are may definitions of correlation coefficient. The Preason's Correlation Coefficient is widely used as a measure of correlation. Let \(\small{\overline{x}}\), \(\small{\overline{y}}\) and \(\small{s_x}\), \(\small{s_y}\) be the mean and standard deviations of the two samples X and Y respectively for a sample size n. Then, the Peasrson's correlation coefficient is defined as,
R-scripts
In R, the functions, cov() computes the covariance between two data sets.
Similarly, the function cor() computes the Pearson'r correlation coefficient between two data sets
Both the function are defined with similar arguments as,
cov(x,y) returns the covariance.cor(x,y) returns Pearson'r correlation coefficient wherex = a vector of data set Xy = a vector of data set Y Thse two functions are used in the R script below
##################################################
## Compute the covariance and correltion for the following dataset:

x = c(10,20,30,40,50,60,70,80,90,100)

y = c(95, 220, 279, 424, 499, 540, 720, 880, 950, 1200)

cv = cov(x,y)

cr = cor(x,y)

print(paste("covarince = ", round(cv, digits=3)))

print(paste("Pearsons correlection coefficient = ", round(cr, digits=3)))

##############------------------------------------------------
Executing the above script in R prints the following results and figures of probability distribution on the screen:
[1] "covarince =  10549.444"
[1] "Pearsons correlection coefficient =  0.988"
