CountBio
Mathematical tools for natural sciences
Biostatistics with R
One sample Z test
This test is applied to the case when we sample data points from a population which follows a normal distribution, or near normal distribution for which the central limit theorem can be employed. The n data points \(\small{x_1,x_2,.....,x_n} \) are assumed to be the random samples from a Gaussian (or near Gaussian) distribution of mean \(\small{\mu}\) and a known standard deviation \(\small{\sigma}\). According to the central limit theorem, the Z statistic computed from the mean \(\small{\overline{x}}\) of n random samples follow a unit normal distribution given by, \(~~~~~~~~~~~~~~~~~~~~~ \small{Z = \dfrac{\overline{x} - \mu}{\left(\dfrac{\sigma}{\sqrt{n}}\right)} = N(0,1) }\) We proceed with the hypothesis testing as follows:
- We first compute the sample mean \(\small{\overline{x}}\) from the data.
- Knowing the value of mean \(\small{\mu}\) and the standard deviation \(\small{\sigma}\) of the population, we compute the value of Z using above expression.
- The statistical significance (also called "p-value") of this data is then obtained by computing the probability \(\small{P(\gt Z) }\) or \(\small{P(\lt -Z })\) from the unit normal distribution. Under the null hypothesis, the p-value represents the probability of getting the observed statistic Z.
- If the p-value is either smaller than a pre-decided value \(\small{\alpha}\) or the observed Z statistic is outside a given range (\(\small{-Z_0 \leq Z \leq Z_0) }\), we reject the null hypothesis and accept the alternate hypothesis. Here, \(\small{Z_0}\) is the value of statistic above which the area under the unit normal curve is \(\small{\alpha}\).
- We can also reject the null hypothesis if the computed Z statistic for th data is outside the \(\small{(1-\alpha)100\%}\) confidence interval on the population mean.
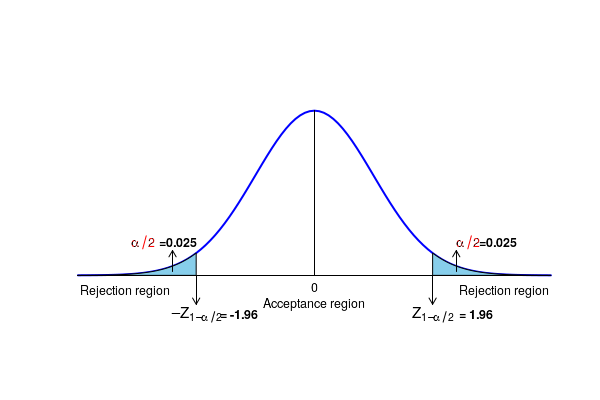
In our case, since the computed Z value of 2.65 is in the rejection region, the two sided null hypothesis is rejected to a significance level of 0.05.
Testing null hypothesis by computing the p-value for the observation: If the null hypothesis is true, what is the probability of getting the computed Z statistic?. This probability is called the"p-value" of the observed test statistic. For the computed Z value of 2.65, the p-value is obtained from the Gaussian table to be \(\small{p = 0.004 }\). This is the area under the curve to the right of \(\small{Z = 2.65 }\) or to the left of \(\small{Z =-2.65 }\). Since the p-value \(\small{p=0.004 }\) of the observed test statistic is less than \(\small{\alpha/2 = 0.025}\), we reject the null hypothesis to a significance level of 0.05.In general, for a 2 sided test, we reject the null hypothesis if \(\small{p \leq \alpha/2 }\). If \(\small{p \gt \alpha/2 }\), we do not reject the null hypothesis.
Testing the null hypothesis by computing the confidence interval: For a significance level \(\small{\alpha = 0.05}\), the $95\%$ two sided confidence interval(CI) for the population mean is given by, \(~~~~~~~~~~~~\small{CI~=~\overline{x} \pm Z_{0.975} {\dfrac{\sigma}{\sqrt{n}} }}\). Substituting \(\small{\overline{x}=135.7,~~\sigma=14.5~~n=12}\) from the data and \(~\small{Z_{0.975}~=~1.96}~\) from Gaussian table, we get a $95\%$ confidence interval of \(\small{CI = 135.7 \pm 1.96*\dfrac{14.5}{\sqrt{12}}= 135.5 \pm 8.20 = (127.5, 143.9)}\) Since this $95\%$ confidence interval \(\small{(127.5, 143.9)}\) does not contain the value the value 124.6, we say that the population mean \(\small{\mu}\) is not equal to 124.6, and hence reject the null hypothesis which states that \(\small{\mu =124.6}\)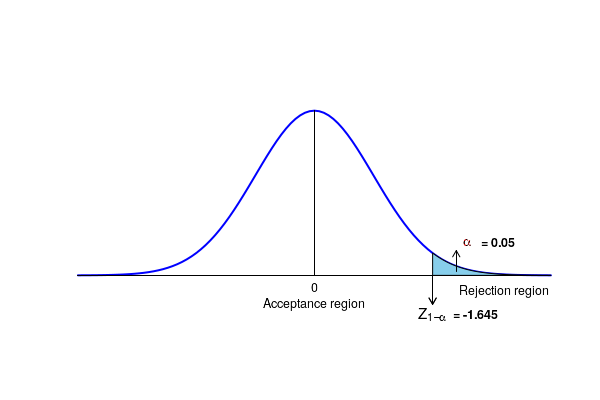
R-scripts
The R script given below performs the one sample Z test. Given a data set x that is assumed to be randomly drawn from a Gaussian distribution of population mean mu and standard deviation sigma, the function returns the conclusions of the test along with computed statistic values.
The function is defined as,one_sample_Z_test(x, sigma, muzero, alpha, null) wherex = data vectorsigma = population standard deviationmuzero = population mean for comparisonalpha = significane levelnull = string value indicating type of null hypothesis. Possible values of variable null are:"equal", "less_than_or_equal", "more_than_or_equal" The function returns a vector with two numbers :(p value, Z statistics) .
###################################################
## One sample Z test

## x = vector of data samples, which are numbers
## sigma = population standard deviation
## muzero = population mean for comparison
## alpha = significance level for testing
## null = string with three possible values "equal, "greater_than_or_equal,"less_than_or_equal"
           for indicating whether the test is one sided or two sided.

one_sample_Z_test = function(x, sigma, muzero, alpha, null  ){

 ## compute sample mean
 xbar = mean(x)

 ## get the sample size
 n = length(x)

 ## compute the Z statistic
 Z_statistic = (xbar - muzero)/(sigma/sqrt(n))

 ## compute the p-value
 pvalue = 1.0

 if(Z_statistic > 0)
    pvalue = 1 - pnorm(Z_statistic)

 if(Z_statistic & 0)
    pvalue = pnorm(Z_statistic)

 if(Z_statistic == 0)
    pvalue = 0.5


 ## Perform the statitical test by comaring the computed Z statistic with the
 ##    critical value for various cases


 ### Case 1 : Null hypothesis that populatin mean equals a given value

 if(null == "equal")
 {
   Z_critical = qnorm(1 - (alpha/2))

   print("################################################################")
   print("One sample Z test : ")
   print(paste("sample size = ", n))

   if( (Z_statistic > Z_critical) | (Z_statistic < -Z_critical) )
   {
     print("One sample Z test : ")
     print(paste("sample size = ", n))
     print(paste("Null hypothesis is rejected at the level of significance ", alpha/2))
     print(paste("Population mean not equal to ", muzero))
     print(paste("p value for the test = ", round(pvalue, digits=5)))
     print(paste("Value of Z statistic = ", round(Z_statistic, digits=2)))
     print(paste("Critical value of the test = ", round(Z_critical, digits=2)))
     resultVec = c(round(pvalue, digits=5), round(Z_statistic, digits=2))
   }

   if( (Z_statistic < Z_critical) & (Z_statistic > -Z_critical) )
   {
     print("One sample Z test : ")
     print(paste("sample size = ", n))
     print(paste("Null hypothesis is accepted at the level of significance ", alpha/2))
     print(paste("Population mean equal to ", muzero))
     print(paste("p value for the test = ", round(pvalue, digits=5)))
     print(paste("Value of Z statistic = ", round(Z_statistic, digits=2)))
     print(paste("Critical value of the test = ", round(Z_critical, digits=2)))
     resultVec = c(round(pvalue, digits=5), round(Z_statistic, digits=2))
   }
  }


 #####  Case 2 : Null hypothesis that population mean is less than or equal to a given value

 if(null == "less_than_or_equal")
 {
   Z_critical = qnorm(1 - alpha)

   print("################################################################")
   print("One sample Z test : ")
   print(paste("sample size = ", n))

   if( Z_statistic > Z_critical )
   {
     print("One sample Z test : ")
     print(paste("sample size = ", n))
     print(paste("Null hypothesis is rejected at the level of significance ", alpha))
     print(paste("Population mean greater than ", muzero))
     print(paste("p value for the test = ", round(pvalue, digits=5)))
     print(paste("Value of Z statistic = ", round(Z_statistic, digits=2)))
     print(paste("Critical value of the test = ", round(Z_critical, digits=2)))
     resultVec = c(round(pvalue, digits=5), round(Z_statistic, digits=2))

   }

   if( Z_statistic <= Z_critical )
   {
     print("One sample Z test : ")
     print(paste("sample size = ", n))
     print(paste("Null hypothesis is accepted at the level of significance ", alpha))
     print(paste("p value for the test = ", round(pvalue, digits=5)))
     print(paste("Value of Z statistic = ", round(Z_statistic, digits=2)))
     print(paste("Critical value of the test = ", round(Z_critical, digits=2)))
     resultVec = c(round(pvalue, digits=5), round(Z_statistic, digits=2))

   }
 }


 ###### Case 3 : Null hypothesis that the population mean is less than or equal to a given value.

 if(null == "greater_than_or_equal")
 {
   Z_critical = qnorm(1 - alpha)

   print("################################################################")
   print("One sample Z test : ")
   print(paste("sample size = ", n))

   if( Z_statistic &l Z_critical )
   {
     print("One sample Z test : ")
     print(paste("sample size = ", n))
     print(paste("Null hypothesis is rejected at the level of significance ", alpha))
     print(paste("Population mean is less than ", muzero))
     print(paste("p value for the test = ", round(pvalue, digits=5)))
     print(paste("Value of Z statistic = ", round(Z_statistic, digits=2)))
     print(paste("Critical value of the test = ", round(Z_critical, digits=2)))
     resultVec = c(round(pvalue, digits=5), round(Z_statistic, digits=2))

   }

   if( Z_statistic >= Z_critical )
   {
     print("One sample Z test : ")
     print(paste("sample size = ", n))
     print(paste("Null hypothesis is accepted at the level of significance ", alpha))
     print(paste("p value for the test = ", round(pvalue, digits=5)))
     print(paste("Value of Z statistic = ", round(Z_statistic, digits=2)))
     print(paste("Critical value of the test = ", round(Z_critical, digits=2)))
     resultVec = c(round(pvalue, digits=5), round(Z_statistic, digits=2))

   }
 }


    return(resultVec)


 }  ## end of the function


###############------------------------------------------------

## Perform a sample test with the function

## define a data set
x = c(141.5, 152.3, 121.2, 123.0, 151.6, 124.8, 138.9, 137.4, 145.6, 135.6, 135.4, 121.5)

## mean to be compared
muzero = 124.6

#population standard deviation
sigma = 14.5

## alpha value
alpha = 0.05

## call the function. "res" is a vector with p-vlue and Z value for the test.
res = one_sample_Z_test(x, sigma, muzero, alpha, "equal")

print(res)
Executing the above script in R prints the following results and figures of probability distribution on the screen:
[1] "################################################################"
[1] "One sample Z test : "
[1] "sample size =  12"
[1] "One sample Z test : "
[1] "sample size =  12"
[1] "Null hypothesis is rejected at the level of significance  0.025"
[1] "Population mean not equal to  124.6"
[1] "p value for the test =  0.00391"
[1] "Value of Z statistic =  2.66"
[1] "Critical value of the test =  1.96"
[1] 0.00391 2.66000